19 Jun 2026
Algorithmic Lineup Optimizations Redefining Starting Rotations in Baseball Bullpens and Basketball Lineups
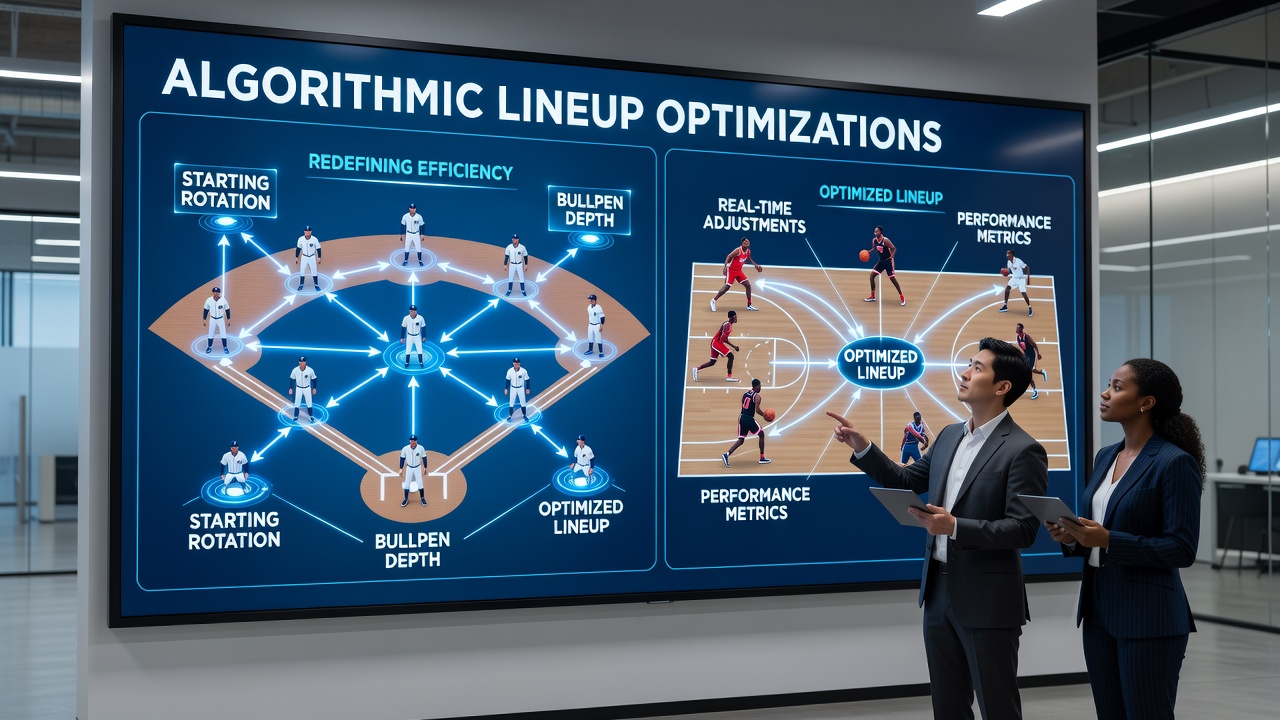
Teams across Major League Baseball and the National Basketball Association continue to integrate algorithmic tools that adjust starting rotations along with bullpen deployment patterns while reshaping basketball lineups through data-driven substitution sequences. These systems process vast datasets on player performance metrics, opponent tendencies, and situational variables to generate recommendations that front offices and coaching staffs implement during games and across seasons. Research from academic institutions such as the University of Michigan has documented how machine learning models analyze pitch velocity correlations alongside defensive positioning data to suggest bullpen matchups that reduce run expectancy in late innings.
Baseball Rotation Adjustments Through Predictive Modeling
Starting pitchers in baseball now receive deployment schedules informed by algorithms that evaluate historical fatigue indicators, pitch mix effectiveness against specific lineups, and weather conditions at ballparks. One study conducted by researchers at the University of California tracked how clubs using these optimizations adjusted starter workloads during the 2025 campaign and observed measurable shifts in innings pitched per start without corresponding increases in injury reports. Bullpen usage has evolved similarly because models calculate leverage situations based on win probability added values and recommend specific relievers for high-leverage frames while accounting for platoon advantages and recent velocity trends. Data shows that several organizations have reduced average bullpen ERA in the middle innings by aligning left-handed specialists against power-hitting right-handed batters at rates higher than previous manual approaches allowed.
June 2026 has brought further refinements as teams incorporate real-time biometric feeds from wearable devices into their optimization engines and this integration allows for mid-game adjustments when algorithms detect deviations from expected recovery curves. Observers note that clubs with robust front-office analytics departments have posted higher success rates in preserving leads during the seventh through ninth innings compared with organizations relying primarily on traditional scouting reports.
Basketball Lineup Construction and Substitution Patterns
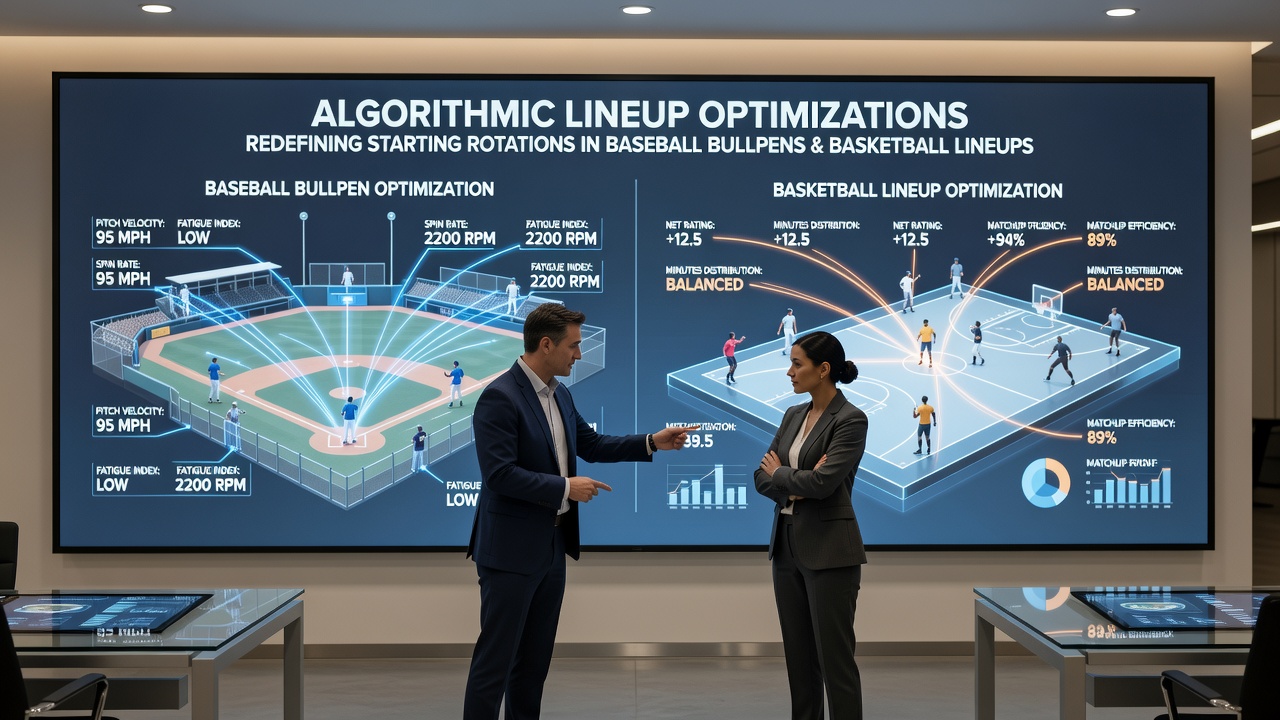
Basketball franchises apply comparable algorithmic frameworks to determine starting five combinations and bench rotation sequences that maximize net rating margins across different opponent defensive schemes. Models ingest tracking data on spacing efficiency, defensive assignment success rates, and transition play frequencies to output lineup suggestions that coaches deploy during timeouts and between quarters. Figures reveal that teams adopting these methods have recorded improved offensive efficiency ratings when pairing stretch bigs with perimeter creators in specific minutes segments against switching defenses. Substitution patterns have grown more fluid because algorithms calculate optimal rest intervals for star players based on workload accumulation models and opponent fatigue projections throughout extended regular seasons.
Coaching staffs receive alerts on potential mismatches during games and these prompts lead to earlier bench insertions for players whose algorithmic profiles indicate strong performance against particular defensive coverages. The approach mirrors developments in baseball yet adapts to basketball's continuous flow and higher substitution frequency which creates more granular decision points per contest.
Cross-Sport Implementation Trends and Data Integration
Front offices in both leagues now share certain computational techniques because vendors supply platforms that adapt core algorithms across different rule sets and game structures. Teams collect comparable datasets on player movement, physiological responses, and historical outcomes and feed these inputs into unified modeling environments that generate sport-specific recommendations. Evidence suggests that organizations maintaining centralized analytics groups achieve faster iteration cycles when testing new variables such as pitch clock effects in baseball or shot clock reset scenarios in basketball. External partnerships with technology firms have accelerated deployment timelines because these companies provide cloud-based processing power capable of handling the volume of data generated during live events.
Training sessions incorporate algorithm outputs to simulate high-probability matchups and this preparation allows players to rehearse responses to situations that models identify as critical. Rosters have adapted by developing depth charts that align with algorithmic preferences for certain skill combinations during different game phases.
Conclusion
Algorithmic lineup optimizations have produced measurable changes in how baseball bullpens receive deployment orders and how basketball benches cycle through rotations based on quantitative signals rather than solely on managerial intuition. Continued refinement of these systems through additional data streams and cross-league collaboration points toward sustained evolution in strategic decision-making across both sports.