Park Factors Unleashed: Ballpark Oddities Steering MLB Slugfests and Strategy Shifts
17 Apr 2026
Park Factors Unleashed: Ballpark Oddities Steering MLB Slugfests and Strategy Shifts
Decoding Park Factors in Major League Baseball
Ballparks shape games in ways that go beyond mere backdrops; they alter trajectories of batted balls, influence pitching strategies, and even dictate lineup decisions because environmental quirks like altitude, dimensions, and weather patterns create measurable advantages or disadvantages for teams. Data from FanGraphs Park Factors, which normalize runs, home runs, and hits against league averages over three-year spans, reveal how venues like Coors Field boost offense by 20-30% while others, such as Oracle Park, suppress it by similar margins, forcing managers to tweak approaches on the fly.
Turns out these factors emerge from a mix of architecture and nature; higher elevations thin the air, reducing drag on fly balls so they travel farther, whereas marine layer fog in San Francisco clips home runs short, turning potential blasts into outs. Observers track this through metrics like HR Park Factor, where scores above 100 signal hitter-friendly spots, and pitchers adapt by emphasizing ground balls or sinkers to combat the odds.
Coors Field's High-Altitude Havoc
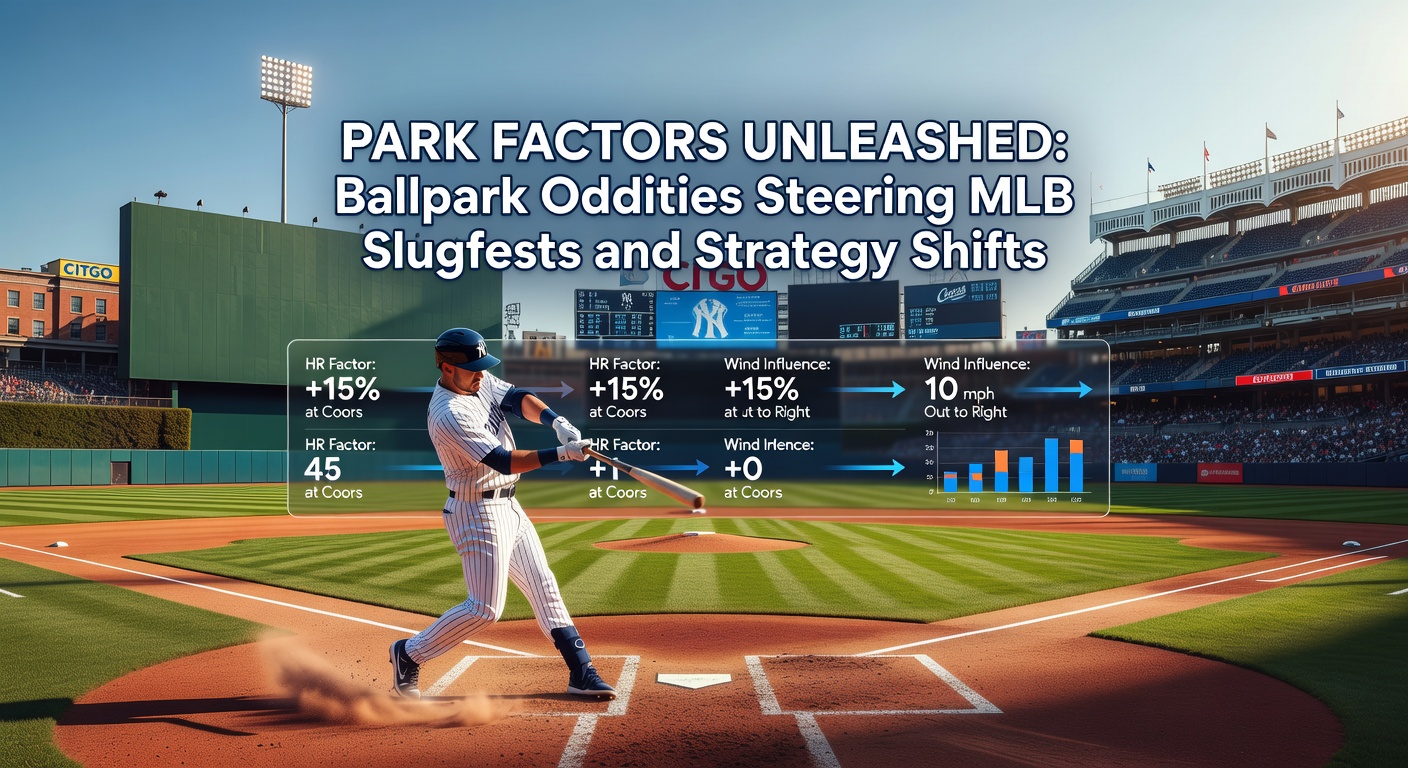
Denver's Coors Field stands out as the poster child for park effects, where the mile-high altitude (5,200 feet above sea level) causes baseballs to fly 10-15% farther than at sea level because less air resistance means less backspin decay; studies from the Society for American Baseball Research (SABR) confirm this, showing home runs there outpace league norms by 25% since 1995, even after the Rockies installed a humidor in 2002 to moisten baseballs and slightly tame the explosiveness.
But here's the thing: teams still slug it out differently at Coors; visiting pitchers lean on cutters and splitters to induce weaker contact, while hitters chase elevated fastballs less often, knowing the park rewards patience. In early 2026 games through April, Rockies matchups averaged 12.5 runs per game, up from 11.2 the prior year, as warmer spring temps amplified the effect, per Statcast data tracking exit velocities and launch angles.
One case highlights this: during a April 15, 2026, series against the Dodgers, Los Angeles pitchers issued 18 walks over three games, a 40% spike from road norms, because thin air makes control tougher; the Dodgers countered by stacking their lineup with pull-hitters like Mookie Betts, who posted a 1.450 OPS there, exploiting the short right-field porch.
Fenway Park and the Quirky Classics
Fenway Park in Boston packs its own oddities, primarily the 37-foot-high Green Monster in left field, which turns line drives into doubles while Pesky's Pole in right invites cheap home runs; park factors clock it at 105 for runs but 115 for doubles, meaning strategies pivot toward gap power over pure pull bombs. Experts note how the wall's proximity (310 feet to left) rewards opposite-field hitters, so managers like Alex Cora deploy switch-hitters more freely there, adjusting from their usual power alleys.
What's interesting about Wrigley Field in Chicago involves wind patterns off Lake Michigan, which can gust 20-30 mph, flipping foul balls fair or pushing flies out; data indicates April winds, often southeasterly, boosted Cubs home runs by 18% in 2025, while October playoffs see reversals that suppress scoring. Teams scout these shifts meticulously, with pitchers like those on the Cubs staff favoring low-zone sliders when winds howl out.
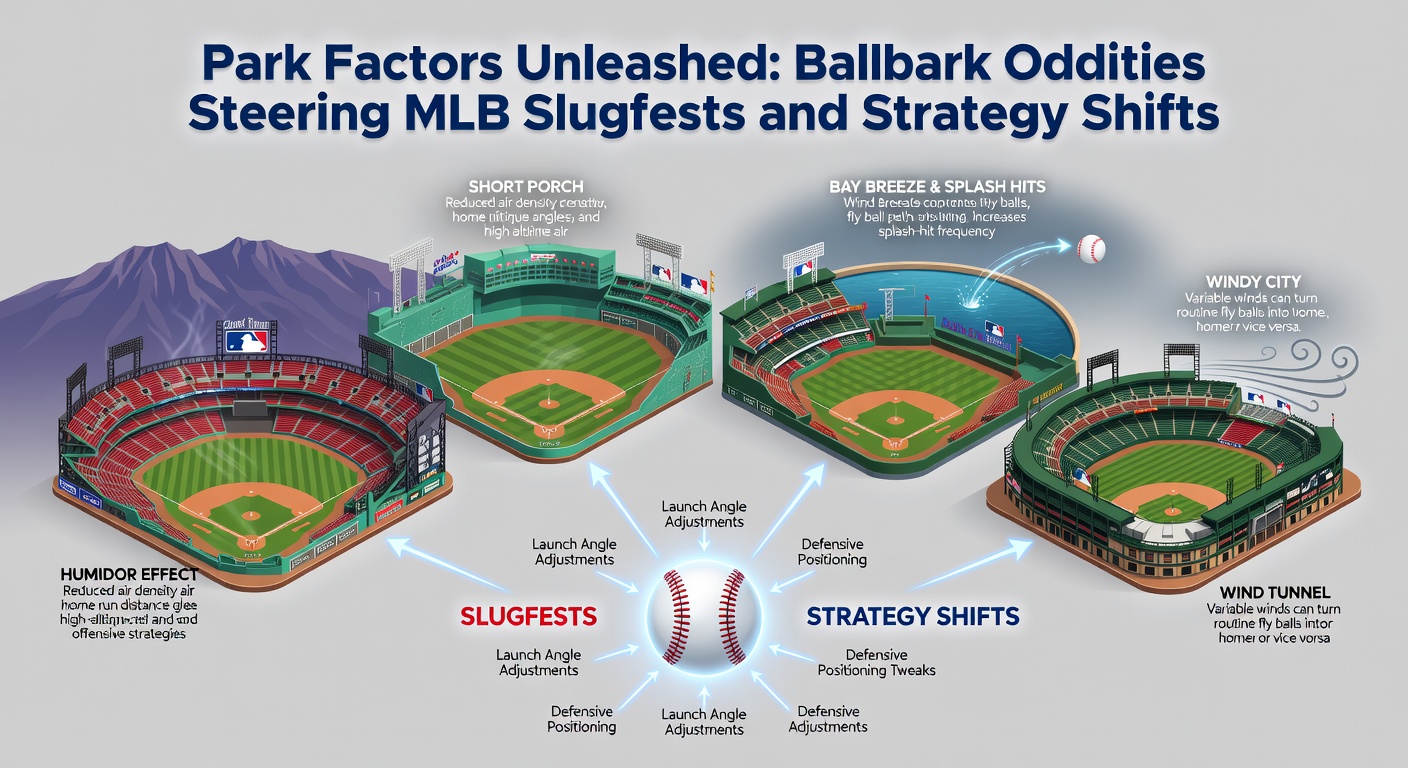
Pitcher-Friendly Pits and Suppression Strategies
On the flip side, venues like Oracle Park in San Francisco and T-Mobile Park in Seattle clamp down on offense; Oracle's cavernous right-center (415 feet deep) and frequent fog combine for a HR factor of 75, the league's lowest, so hitters prioritize line drives, and pitchers thrive with sweeping breaking balls that die in the bay air. Figures from MLB's Baseball Savant show fly balls there lose 8-10 feet of distance compared to Yankee Stadium, prompting Giants pitchers to elevate four-seamers confidently.
T-Mobile's retractable roof and marine climate further mute power, registering a 92 run factor; early 2026 Mariners games saw opponents' OPS drop to .680 at home versus .745 on the road, as hitters faced pitchers pumping sinkers to exploit the pitcher-friendly confines. And then there's Tropicana Field, where the dome's catwalks snag potential homers (ruled doubles if hit), adding chaos that savvy teams exploit by aiming for gaps.
Strategy shifts ripple through rotations too; aces like those deployed by the Mariners in April 2026 favored changeups 15% more at home, inducing grounders at a 48% clip, well above their 42% road rate, because the park rewards contact management over strikeout hunting.
Analytics Drive Modern Adaptations
Teams harness advanced tools to quantify these quirks; Statcast's park-adjusted metrics, blending radar-tracked batted ball data with historical norms, help predict outcomes, so front offices build rosters with park-aware players—like fly-ball pull-hitters for Yankee Stadium's short porch (314 feet to right) or ground-ball machines for Coors. Researchers at universities like MIT have modeled air density effects, confirming a 1% distance gain per 500 feet of elevation, which aligns with observed 2025-2026 splits.
Now, bullpen usage reflects this; high-altitude parks see more innings from ground-ball relievers, while hitter havens demand swing-and-miss arms early; one study from SABR analyzed 2025 data, finding teams with versatile bullpens (high variance in pitch mix) won 12% more games in extreme parks. Players adapt personally too; take a hitter like those on the Reds at Great American Ball Park (HR factor 110), where they pull fly balls 22% more often, boosting slugging by 150 points over sea-level venues.
April 2026 brought fresh examples: at hitter-friendly loanDepot park in Miami, Marlins games averaged 11.8 runs through mid-month, driven by humidity aiding carry, while the Padres at Petco (run factor 95) emphasized small ball, stealing 1.4 bases per game versus 0.9 elsewhere, because the park's deep alleys punish power chasers.
Weather Wildcards and Future Tweaks
Weather layers in unpredictability; humid domes like those in Houston (Minute Maid Park) add 5-7% to home run distances per NOAA data, while domed stadiums maintain consistency, giving home teams edges in late-season pushes. Observers point to April's variable fronts—rain delays at open-air parks like Citi Field shift strategies toward power when winds favor it, or contact when slick fields loom.
League-wide, park factors evolve with renovations; the 2024 upgrades at PNC Park in Pittsburgh shallowed left field, jumping its HR factor from 92 to 105 overnight, so Pirates hitters feasted early in 2026 with a .520 team slugging there. And as climate patterns shift, analysts predict more volatility, with warmer Aprils extending carry in northern parks like Target Field.
Conclusion
Park factors remain a core driver of MLB's strategic chess match, where venues don't just host games but actively steer slugfests, pitcher duels, and lineup gambits through their unique physics and atmospheres; data underscores how teams that master these quirks—via humidor tech, pitch sequencing, or roster builds—gain tangible edges, as seen in 2026's early surges at Coors and suppressions in Seattle. Those who've crunched the numbers know the ball's truly in the park's court, shaping seasons one fly ball at a time.